- Aggregate Product Loaded Widget
- Site Connection Status Widget
- Transports Loaded Widget
- Integration Order Export Status
- Bulk Product Allocation
- Dwell Time
- Monthly Email Usage
- Tank Level
Aggregate Product Loaded Widget
This widget gives a summary of product movement over time. A dropdown allows changing the product displayed. Aggregates are shown for either all sites over the last hour, day, week, and month for the selected product.

Detailed View
Clicking on the Aggregate Product Loaded widget changes the page to the Detailed View of Aggregate Product Loaded. The page allows comparing product movement for one site versus either the aggregate of all sites or any one other site.
Aggregate comparisons are shown for the last hour, day, week, and month.

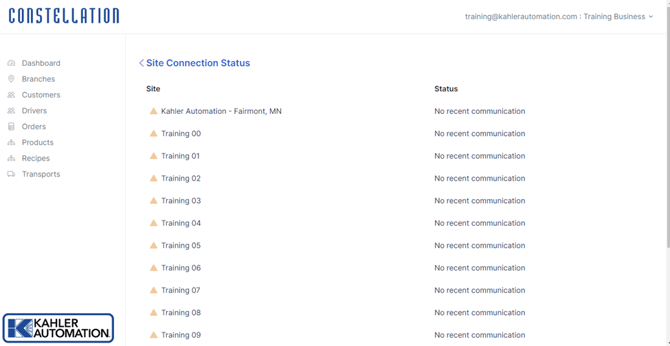
Site Connection Status Widget
This widget shows a list of sites, if any, with current connection issues. Sites with connection issues will not receive updates to synchronize information until the connection issue is resolved. Possible issues include internet service interruptions, servers being powered down, and name collisions.

Detailed View
Clicking the Site Connection Status widget changes the page to the Site Status page, which shows all connected sites and their status. The list is sorted so that any sites with issues are shown at the top; sites with no issues are listed at the bottom.
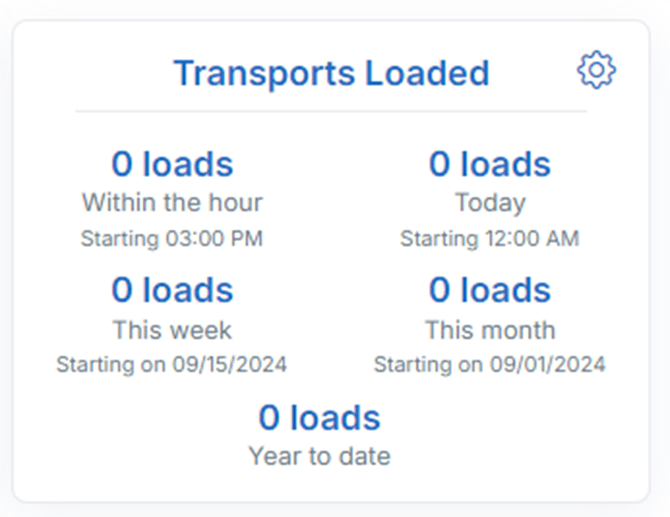
Transports Loaded Widget
This widget shows a summary of loads over time. Aggregates are shown for all sites or one single site over the last hour, day, week, and month for the selected product.
Integration Order Export Status
This widget details the last several complete orders and the reporting status back to a companies ERP/Agronomy software. Green icons are shown for orders successfully reported back while yellow triangles are orders which are pending.
Click on the widget will show more details.

Bulk Product Allocation
This widget gives a comparison of current inventory versus orders in the system. Options allow selecting up to five products and may show all sites or one single site.
Shown below, dark blue is inventory levels, light blue is open orders, and red where open orders exceed current inventory.

Dwell Time
This widget gives a summary of dwell time on site as measured from the check-in or load starting to a final signature. Options allow for specific statics to be shown. For more information, see Constellation Dashboard - Dwell Time

Monthly Email Usage
This widget gives a summary of emails sent by Constellation. Usage will reset on the first of each month. For more information, see Constellation - Emails.
Status icon will be green up to the limit of 6,000 emails; yellow up to 8,999 emails; red above 8,999 emails. Service will also be paused above 8,999 emails.
Tank Level
This widget gives a look at current tank levels, updated as often as once a minute. For more information, see Constellation - Dashboard - Tank Level Monitoring.

Still Need Help?
Submit an online web ticket or call us at Kahler Automation 507-235-6648 Option 2.